
Arbieroo
these are really aesthetically pleasing:
Arbieroo

SteveBob
Yes, they are.

🧊wotitdo🧊
math is very cool

JigmeDatse
Very much... But are they supposed to be so darn ... non-chaotic?
JigmeDatse
Deterministic looking?
JigmeDatse
The early parts look decently chaotic.
Arbieroo
the early parts are effectively noise due to poor statistics.
Arbieroo
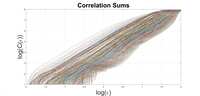
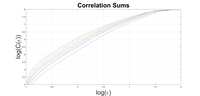
these graphs are about the fractal nature of chaotic attractors. Specificly the Lorenz attractor in this case.
JigmeDatse
OK. Are these expected results?
JigmeDatse
That makes sense (I think).
Arbieroo
yes - the lines on the first graph that have a long approximately straight region (constant slope) give accurate results.
Arbieroo
Arbieroo
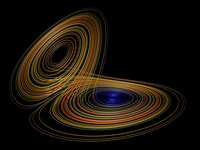
^Lorenz Attractor, generated by a set of three coupled differential equations.
Arbieroo
It's fractal, which is defined as "self-similar on all scales (below that of the whole object)."
Arbieroo
so if you zoom in on one area it looks a lot like before you zoomed in and no matter how far you zoom in it still looks like before you zoomed in...
JigmeDatse
if you've read Mandlebrot.
Arbieroo
so one way to test if an object is fractal is to ask, for a reference point, how many other points are in a neighbourhood of fixed radius?
Arbieroo
only about Mandelbrot.
JigmeDatse
Ah, I have his Fractal Geometry of Nature. I've only dipped my toes into it.
Arbieroo
if you do this for a large number of reference points and for a big range of neighbourhood sizes, then plot the log of the number of neighbours vs. the log of the radiuses of the neighbourhoods, then a fractal will have a line of constant slope. The value of that slope is the Correlation Dimension, which will be non-integer.
Arbieroo
if you try to do this with real data, the fact that you have a finite number of points affects the results; at a small enough scale there are too few points and the results deviate from the straight line. Also, as the scale approaches the scale of the whole attractor, the number of points will saturate, which is what you see in the top right.
Arbieroo
just to additionally complicate things, what I've done here is try to reconstruct the full attractor from a time series of only one variable. The results are then parameter dependent.
Arbieroo
the best results are the ones with the longest straight-line segments. Generally, moving toward the right the results get worse.
Arbieroo
this is where my efficient agorithms come in; previously one had to guess the optimal parameters in advance because it took so long to do the calculations. Unfortunately none of the published methods of doing so reliably worked across a wide range of cases.
Arbieroo
there are 334 different parameter pairs represented on the graphs. It took ~10 s per case (1 hr total) to do all the calculations. The previous method takes ~3 mins per case on the same hardware.
Arbieroo
that would be ~17 hrs total.
Arbieroo
hence I can do a wide parameter range and pick the best ones, rather than guess the best one ahead of time and probably be wrong about it...
JigmeDatse
Very impressive...
Arbieroo
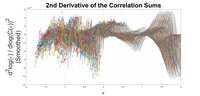
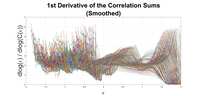
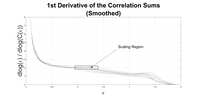
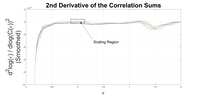
the first derivative will be horizontal in the scaling region - which makes it easier to identify. The 2nd derivative will be zero in the scaling region.
Arbieroo
all the bad results mask the scaling region on those graphs...
Arbieroo
...but they look really cool...
Arbieroo
...and I've just cracked the theoretical explanation for the general structure of where graphs start relative to others, depending on the parameter pairs. (Again, you can't see it on these examples.)
JigmeDatse
Dang, I was having trouble with confirming the horizontal, where you have a constant slope... Brain is not braining.
Arbieroo
y = mx + c, dy/dx = m = constant. Then differentiate again, d^2y/dx^2 = 0.
Arbieroo
after I've slept I'll post an example where you can see what's going on...

beken
Fascinating.
Arbieroo
Arbieroo
^example where the scaling region is observable in the derivatives.
JigmeDatse
Very cool.

Lemongrass
they are!